The t-Test: Detailed Explanation, Proofs, and Derivations
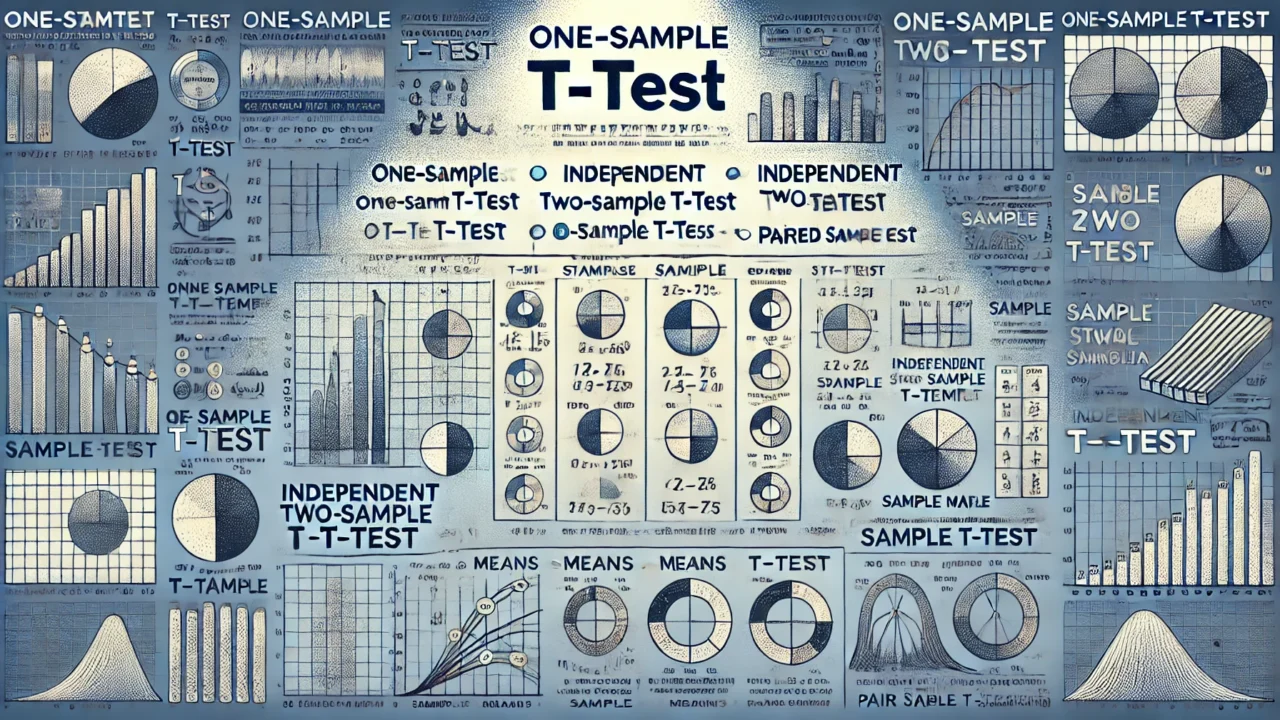
The t-test is a statistical test used to determine if there is a significant difference between the means of two groups. It is commonly used when the variances of two normal distributions are unknown and the sample sizes are small.
Types of t-Tests
There are three main types of t-tests:
1. One-sample t-test: Determines if the mean of a single sample is different from a known mean.
2. Independent two-sample t-test: Determines if the means of two independent samples are different.
3. Paired sample t-test: Determines if the means of two related groups are different.
One-Sample t-Test
The one-sample t-test compares the sample mean \( \bar{x} \) to a known value (or hypothesized population mean) \( \mu_0 \). The test statistic is calculated as:
$$ t = \frac{\bar{x} – \mu_0}{s / \sqrt{n}} $$
where:
– \( \bar{x} \) is the sample mean,
– \( s \) is the sample standard deviation,
– \( n \) is the sample size.
The degrees of freedom for this test are \( df = n – 1 \).
Independent Two-Sample t-Test
The independent two-sample t-test compares the means of two independent samples. The test statistic is calculated as:
$$ t = \frac{\bar{x}_1 – \bar{x}_2}{\sqrt{\frac{s_1^2}{n_1} + \frac{s_2^2}{n_2}}} $$
where:
– \( \bar{x}_1 \) and \( \bar{x}_2 \) are the sample means,
– \( s_1^2 \) and \( s_2^2 \) are the sample variances,
– \( n_1 \) and \( n_2 \) are the sample sizes.
The degrees of freedom can be approximated using the Welch-Satterthwaite equation:
$$ df \approx \frac{\left( \frac{s_1^2}{n_1} + \frac{s_2^2}{n_2} \right)^2}{\frac{\left( \frac{s_1^2}{n_1} \right)^2}{n_1 – 1} + \frac{\left( \frac{s_2^2}{n_2} \right)^2}{n_2 – 1}} $$
Paired Sample t-Test
The paired sample t-test compares the means of two related groups. The test statistic is calculated as:
$$ t = \frac{\bar{d}}{s_d / \sqrt{n}} $$
where:
– \( \bar{d} \) is the mean of the differences between paired observations,
– \( s_d \) is the standard deviation of the differences,
– \( n \) is the number of pairs.
The degrees of freedom for this test are \( df = n – 1 \).
Derivations and Proofs
Derivation of the One-Sample t-Test
Given a sample \( x_1, x_2, \ldots, x_n \) from a normal distribution with unknown mean \( \mu \) and unknown variance \( \sigma^2 \), we want to test the null hypothesis \( H_0: \mu = \mu_0 \).
The sample mean is:
$$ \bar{x} = \frac{1}{n} \sum_{i=1}^n x_i $$
The sample variance is:
$$ s^2 = \frac{1}{n-1} \sum_{i=1}^n (x_i – \bar{x})^2 $$
Under the null hypothesis, the test statistic is:
$$ t = \frac{\bar{x} – \mu_0}{s / \sqrt{n}} $$
which follows a t-distribution with \( n-1 \) degrees of freedom.
Derivation of the Independent Two-Sample t-Test
Given two independent samples \( x_1, x_2, \ldots, x_{n_1} \) and \( y_1, y_2, \ldots, y_{n_2} \) from normal distributions with unknown means \( \mu_1 \) and \( \mu_2 \) and unknown variances \( \sigma_1^2 \) and \( \sigma_2^2 \), we want to test the null hypothesis \( H_0: \mu_1 = \mu_2 \).
The pooled sample variance is:
$$ s_p^2 = \frac{(n_1 – 1)s_1^2 + (n_2 – 1)s_2^2}{n_1 + n_2 – 2} $$
The test statistic is:
$$ t = \frac{\bar{x}_1 – \bar{x}_2}{\sqrt{s_p^2 \left( \frac{1}{n_1} + \frac{1}{n_2} \right)}} $$
which follows a t-distribution with \( n_1 + n_2 – 2 \) degrees of freedom.
Derivation of the Paired Sample t-Test
Given paired observations \( (x_1, y_1), (x_2, y_2), \ldots, (x_n, y_n) \) from a normal distribution with unknown mean difference \( \mu_d \) and unknown variance of differences \( \sigma_d^2 \), we want to test the null hypothesis \( H_0: \mu_d = 0 \).
The differences are \( d_i = x_i – y_i \).
The mean of the differences is:
$$ \bar{d} = \frac{1}{n} \sum_{i=1}^n d_i $$
The standard deviation of the differences is:
$$ s_d = \sqrt{\frac{1}{n-1} \sum_{i=1}^n (d_i – \bar{d})^2} $$
The test statistic is:
$$ t = \frac{\bar{d}}{s_d / \sqrt{n}} $$
which follows a t-distribution with \( n-1 \) degrees of freedom.
